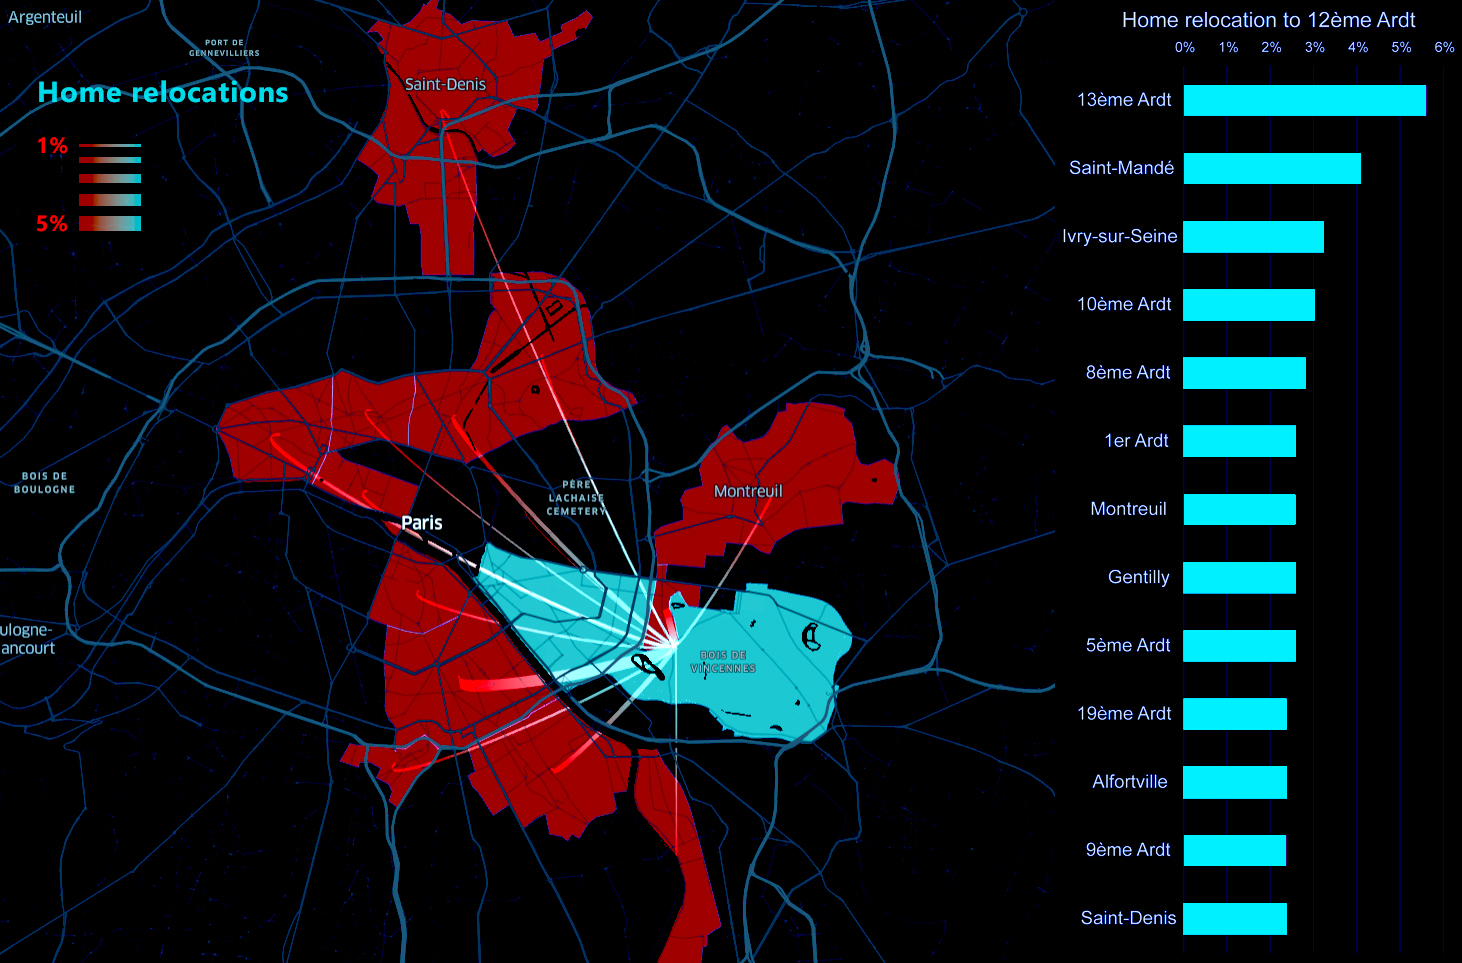
This is the level of detail advanced geospatial data analytics can unearth, revealing the massive business value and potential for applications in industries ranging from retail, F&B, real estate, to hospitality, healthcare, urban mobility, transportation, and smart cities.
Changing demographics, particularly an aging population, transforming family structures, and a fickle consumer behavior, are all posing serious challenges to businesses and governments alike. Retail outlets, shopping malls, healthcare operators, or urban planners desperately need detailed, accurate, and up-to-date information of population demographics and mobility insights and their trends at as much a granular geographic resolution as possible.
PerigonAI uses near real-time streams of massive geospatial big data and has developed advanced data analytics and AI engines to answer these and many other questions relevant to all industries that can benefit from geospatial data and location intelligence. Let's see how we can leverage our in-house big data lake of anonymous location and mobility data in the UAE, to address some of the questions above.
This post will be a general overview of specific macro indicators computed from geospatial data, offering first insights into mobility and demographics in cities, which we shall develop further in upcoming posts. Let's now focus on one simple measure of urban mobility: the radius of gyration. In plain English, this measures the average distance travelled by an individual to meet their daily needs, such as commuting, shopping, or entertainment.
First, the PerigonAI demographic analytics engine infers demographic characteristics such as age, gender, and country of origin from our massive big data lake. We can measure the radius of gyration as an indicator of human mobility for different demographic groups to gain a rough understanding of how cities function.
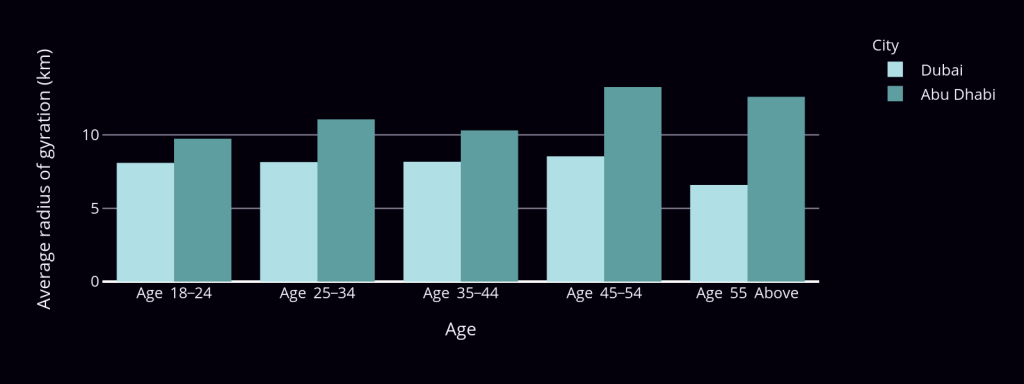
In the bar chart below, you can see the breakdown of the average radius of gyration by age group in Dubai and Abu Dhabi. The first insight that strikes the eye is that people in Abu Dhabi travel longer daily average distances than do people in Dubai. There are a number of hypotheses that can explain this, including higher built-up and population densities, as well as higher accessibility to amenities in Dubai, or the size of Abu Dhabi in comparison to Dubai.
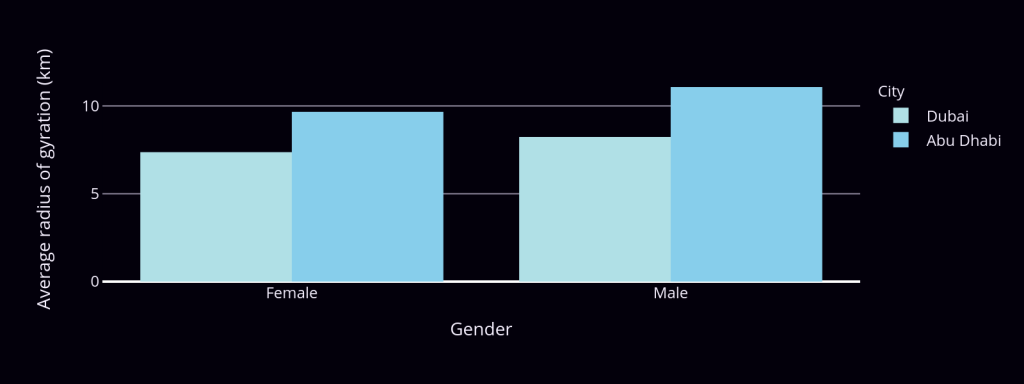
Aggregating the data differently, by gender, we see strong gender inequality in urban mobility as measured by the radius of gyration. Men travel significantly longer distances on average than women do. Due to our global data reach, we see these differences in travel patterns of men and women recurring globally, at different levels in different cities. This is an interesting phenomenon in and of itself, and will be the topic of a forthcoming post.
A powerful measure as it may be, the radius of gyration captures only part of the story. Another way to measure population mobility, or the degree of how mobile people are is the number of distinct locations individuals visit. In other words, not only is it important to measure how far different demographic groups travel on average, but also how many different locations they visit. To illustrate this, let's take a look at the map below:
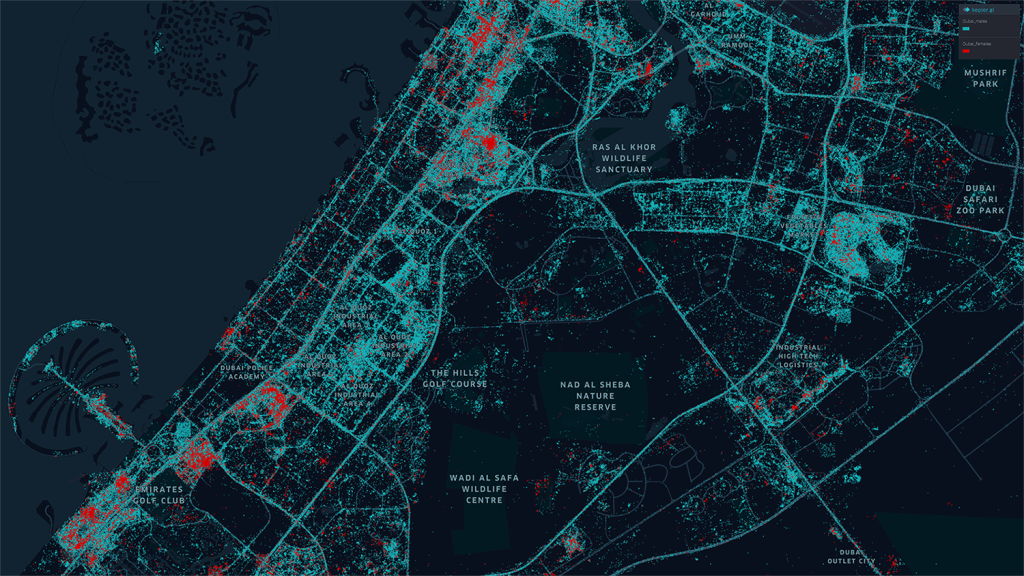
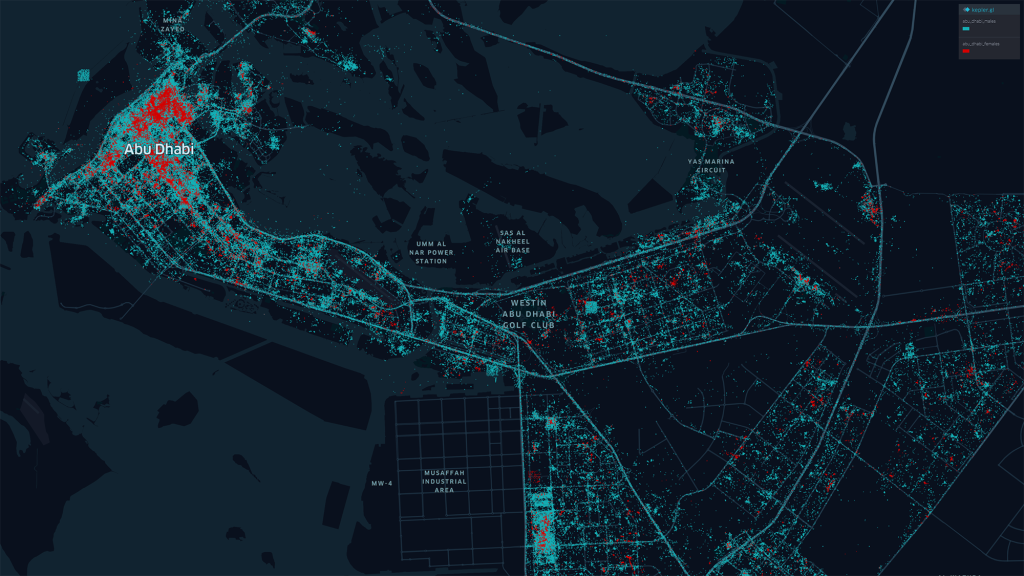
What you see are GPS location data representing trip destinations of equally sized samples of men (turquoise dots) and women (red dots). It's striking to see the red dots clustered in a limited number of areas in the city, while the distribution of turquoise dots is much more scattered across the city. The same is true for Abu Dhabi:
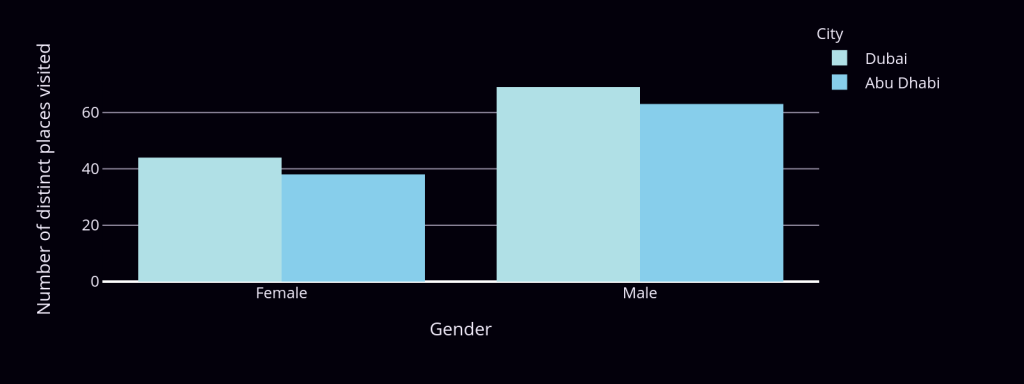
This essentially means that men not only travel longer distances to meet their daily needs, but they also travel to a more diverse set of locations! We can see this numerically in the chart below, representing the average number of distinct locations visited during a typical week by men and women in Dubai and Abu Dhabi:
We see that men visit roughly 1.6 times more distinct locations than women do in both Dubai and Abu Dhabi. Interesting enough, people in Dubai visit more distinct locations than in Abu Dhabi. This observation lends itself to the hypothesis that Dubai as a city has "more to offer" than Abu Dhabi. We see a similar pattern if we look at the same data aggregated by age groups:
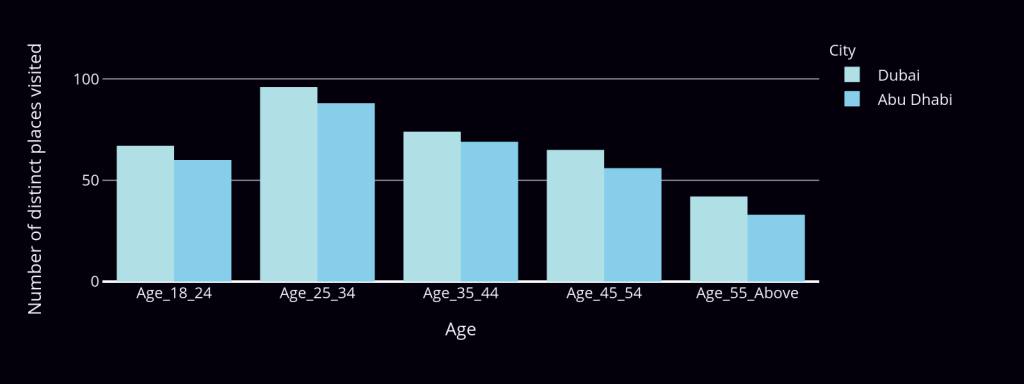
The most mobile age segment are individuals between 25 and 34 years of age. We also see an expected decline in mobility with age as measured by the number of distinct locations visited: older people visit a smaller set of distinct locations. Using terminology borrowed from urban science, younger people tend to be "explorers" while elderly people can be described as "returners". Whether this is due to natural preferences or lack of accessibility and opportunities for the elderly is an interesting question calling for additional research.
Before concluding this article, let's revisit the question of the mobility of expectant parents in the UAE by looking at the bar chart below:
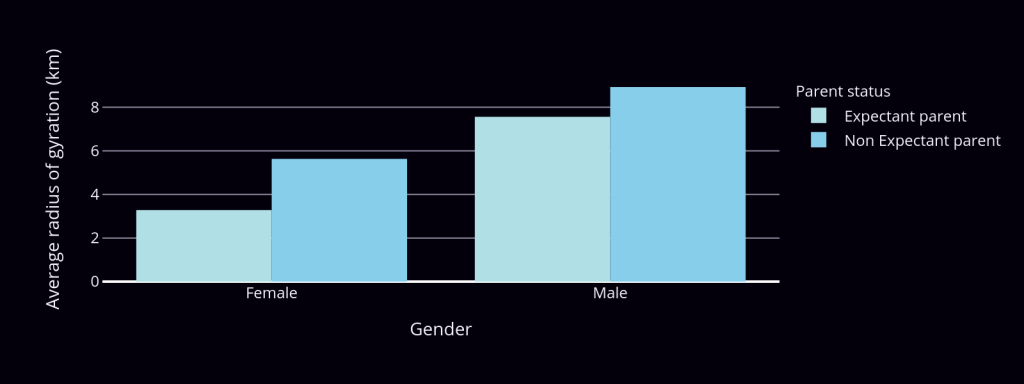
We see a clear difference in the average distance travelled daily by expectant vs. non expectant women and men. Expectant parents, especially women, travel much less than their non expectant counterparts, as expected.
This post was meant to illustrate the power of geospatial data analytics, and to offer a foretaste of the incredible level of detail the PerigonAI data analytics engines can offer. An obvious disclaimer is that the analysis above lacks statistical rigour and was meant as a first exploration of the possibilities offered by a simple analysis of geospatial mobility and demographic data. Stay tuned for more insights and analyses of key industries and urban phenomena relevant to your business!