


One QSR unit in the Gulf costs between 350,000 and 850,000 dollars by the time it opens its doors, and the lease stays with you for years. Before that money moves, someone has to answer one question. If we open here, how much of that store’s sales will be new, and how much will we steal from our own stores nearby.
An operator in Riyadh came to us with seven sites in play. The old way of answering meant four departments in one room, an analyst spending a week on every site, and three months before a decision anyone would sign. The market does not wait three months.
This post is about how that process became a conversation, and the engineering underneath.
Asking the question on the map
Now that question goes straight into the map. Atlas AI sits inside it, and you type what you want to know in plain language. Which of these seven sites earns its lease. It runs the real analyses on your own data, refreshed every week. The map shows catchment, competitors, footfall and forecast while the reply is still being written.
You can argue with it. Widen the drive time to 20 minutes. Try it as a 900 square foot format instead. Show me this against the other six. Nothing resets between questions, so the tenth one can assume everything the first nine established.
Site scouts used to drive the market first and analyze later. Now they forecast the candidate list and drive only to the sites that survive. For this client, 45 percent of site analysis starts as a typed question rather than a module workflow. People ask questions that were never worth a week of analyst time before.
One decision out of the seven
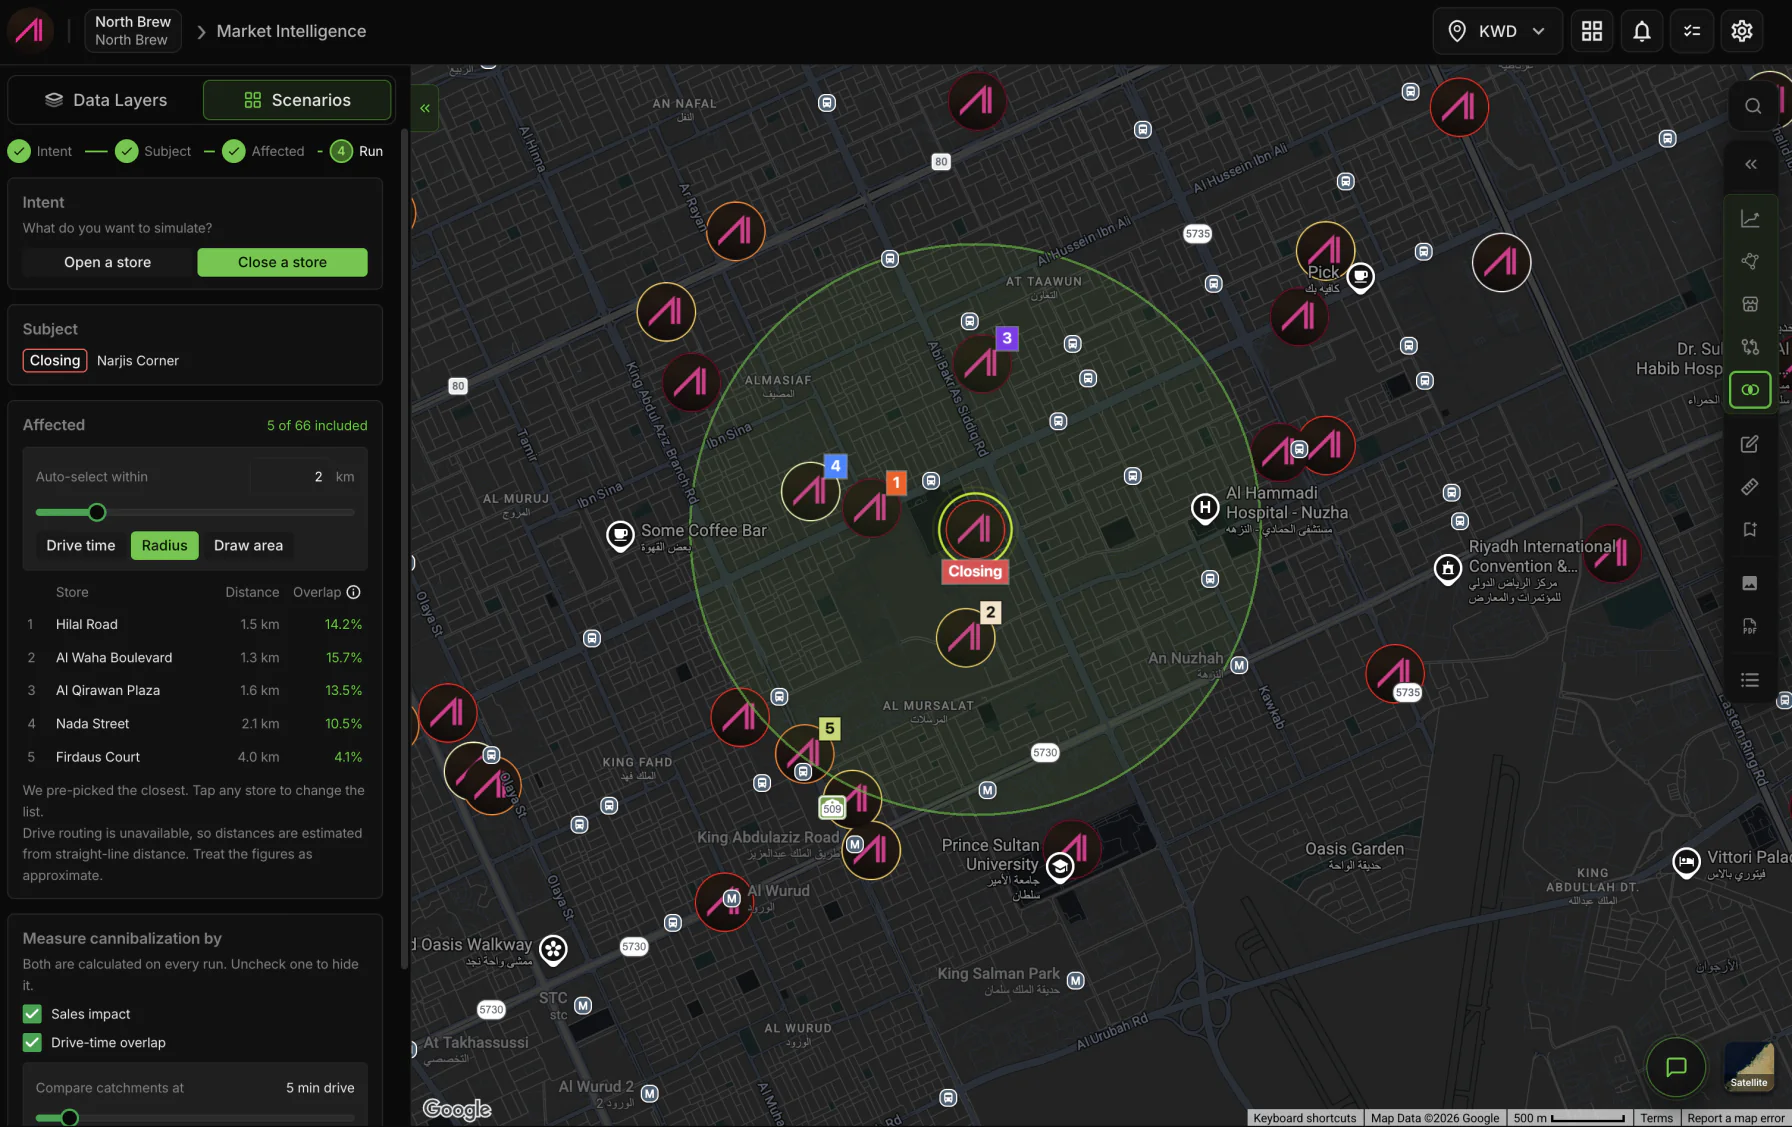
Back to the Riyadh operator. One of their seven sites sat inside a cluster of four stores they already ran. Their question had two parts, what opening here would do to the four, and which one to close if the economics demanded it.
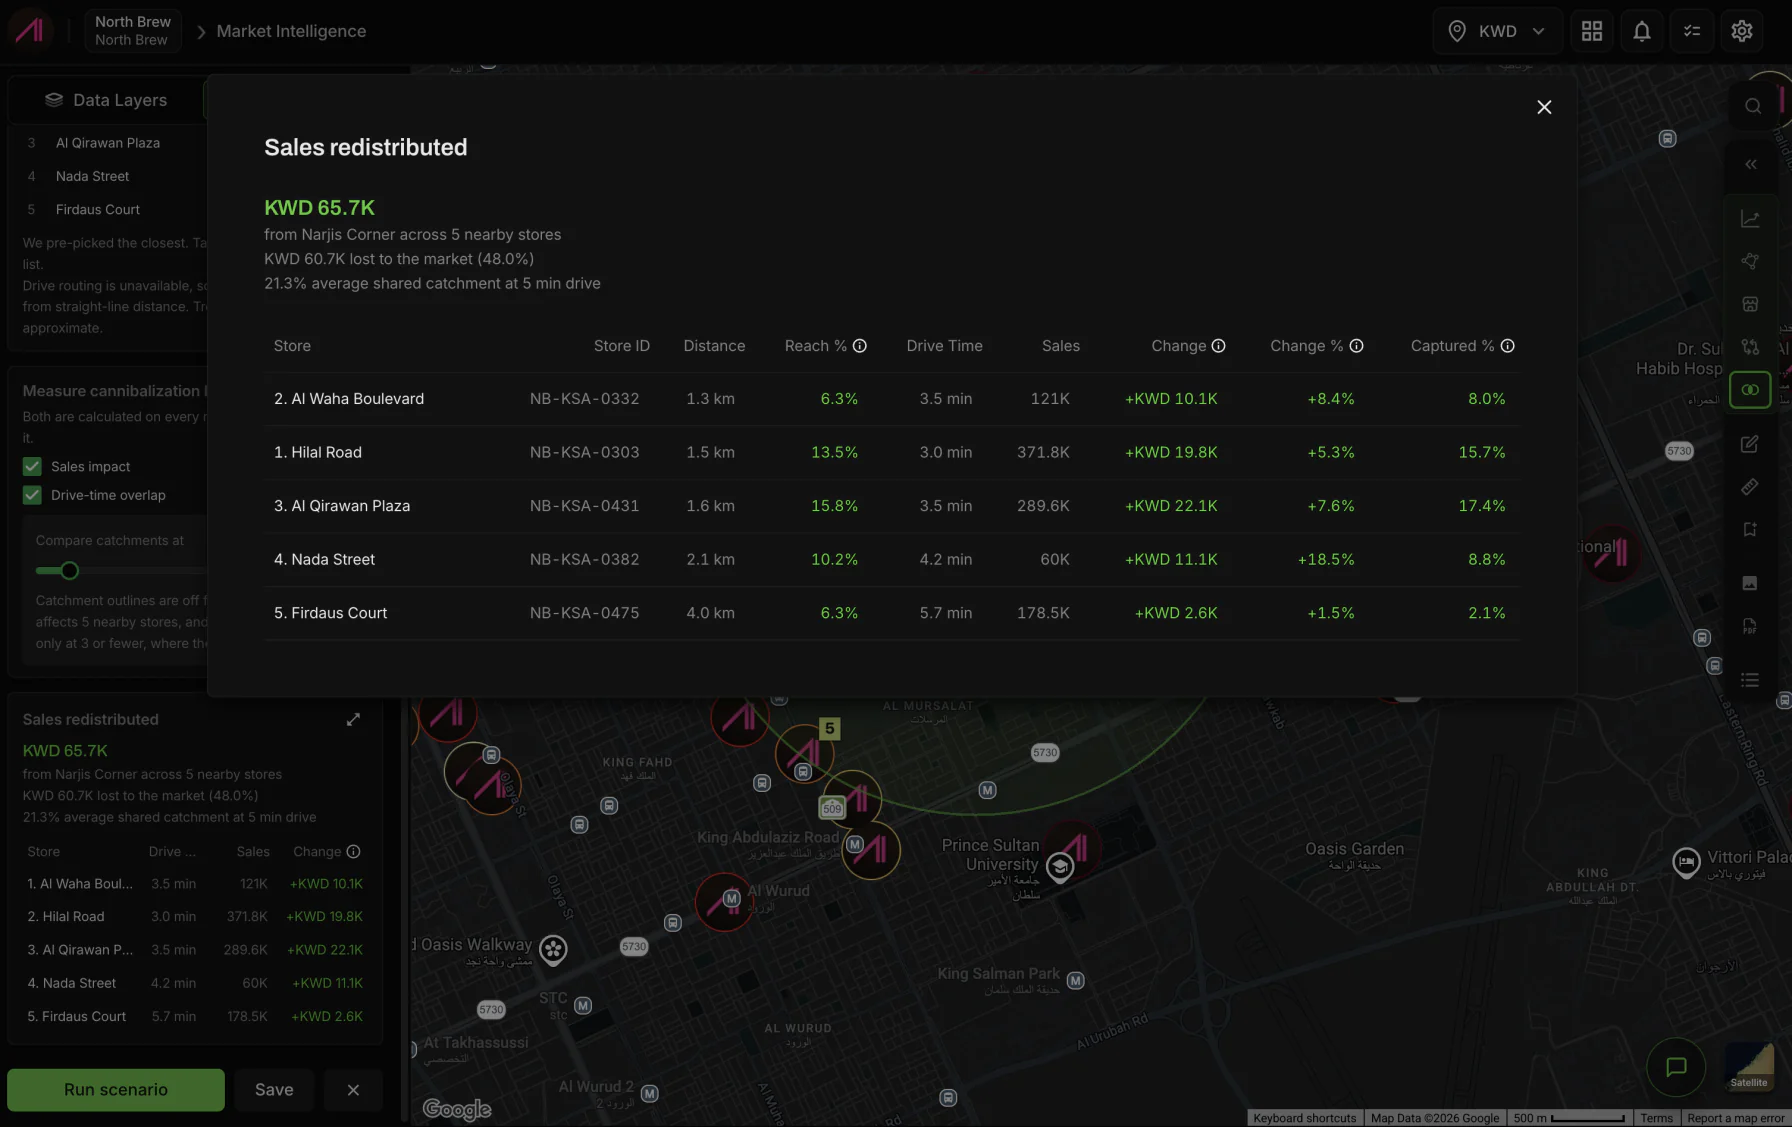
We ran our sales forecasting on the site. The forecast put the new site about 12 percent above the cluster’s average volume. We split the cannibalization estimate by channel. Roughly 18 percent of the new site’s delivery volume was transfer from the existing stores, against 7 percent of its dine in volume. Delivery catchments overlap far more than dine in ones. One combined number would have made the site look worse than it was. Broken out by channel, most of the new site’s sales were coming from customers the cluster didn’t already have.
The split also picked the store to close, and it wasn’t the obvious one on rent. The weakest of the four had a steep renewal coming, and the new site would recapture most of its volume anyway. The client opened the new site, closed that store, and the cluster came out around 10 percent higher in net revenue on a lower total lease cost.
Within 10 percent, measured after opening
Most site analysis ends in a recommendation nobody can attach an accuracy number to. We score every forecast against actual revenue once the store has traded. Our site forecasts land within 10 percent of actual store revenue, measured six months after opening, across more than 150 openings. That figure covers revenue and nothing else. How close the recapture estimate came is a separate question, and only the client’s own transaction data can settle it.
How the answer gets produced
The rest is the engineering. Three problems shaped the build. An honest model, rerunnable answers, and a fast private map.
From one sentence to a chain of tool calls
Say you type “if I open at this corner, what happens to my other stores.” Atlas AI has to turn that sentence into jobs the platform can actually run. It resolves the place you mean, pulls your stores and competitor set from your own data, and starts calling tools.
Drive times run on our own routing engine under live traffic, so the same 15 minute catchment comes out as a different shape at 8am and at 8pm. Forecasting calls the models behind our pin drop forecasts, built on more than eight years of how this region moves and spends. They already know a Gulf trade area empties on Friday afternoon and fills again after Isha, and that Ramadan flips the daypart curve. Cannibalization runs the channel split logic from the case above. Demographics and footfall get pulled for that exact drive time area, whatever shape the roads gave it.
And the map itself is part of the model’s context, which layers are on and which polygon is drawn, so “widen it to 20 minutes” works without restating anything.
Deterministic tools, rerunnable answers
Every tool is deterministic. The same inputs, time and traffic included, give the same outputs, and the model is never allowed to invent a number. It only picks the tools, orders them, and puts the results on the map. That one rule is most of why a chat answer matches what an analyst gets by hand.
Interpretation is the risk that remains. Misread the question and the tools still return something perfectly correct, just to a question nobody asked, and from the outside there’s nothing to distinguish it from a right answer. So Atlas AI shows what it understood and what geometry it resolved before it computes, and asks when a question is ambiguous.
Run the same catchment 20 minutes apart and the polygons differ, because traffic moved. No investment committee is going to approve capital against a number it can’t reproduce. So answers carry their parameters and the exact version of the data they ran on, and anything the chat produced can be rerun in the platform and stand in a committee pack.
Millions of transactions, one question
A question like “which of my stores performs best, and why” isn’t really a map question. Clients keep their whole operating record on the platform, assets, sales history, footfall. Atlas AI can reach all of it. That one question touches millions of sales transactions, and nothing scans those row by row while you wait. We do the expensive work ahead of time so nobody waits. Sales roll up into aggregates as the data lands, scheduled jobs keep those aggregates fresh, and they sit as columnar geo files queried in process alongside the geometry. Only what depends on the question runs live.
Evaluating against ground truth that moves
A fixed golden set of questions doesn’t work here. The datasets refresh every week and every client’s data is different, so the same question has a different right answer for every client. Our eval suite checks which tools were chosen, what geometry the question resolved to, and the final figures against the platform’s own hand-run results, per client in each market, on data that changed since the last run. Access control is part of the pass criteria, enforced on every read in the stack by user role and by client. Queries the model generates at runtime are checked at execution, so a cleverly worded prompt hits the same wall an unauthorized user does. More on the eval system in a post of its own.
Serving the map was the hardest part
The first versions ran on Postgres and PostGIS, and that held until the datasets stopped being small. Past 300 or 400 megabytes, loading got painfully slow, and most platforms we tested wouldn’t accept files that size at all. We tried a lot of things. Tiles were the only approach that worked. Cut the map into small pieces, serve only what the screen needs. Then serving the tiles became its own problem, because GIS traffic looks nothing like normal software traffic. One user playing around with the map fires thousands of requests in a few minutes, and the live insights recompute for whatever the viewport shows on every zoom and scroll.
A consumer map is fast because every user on earth gets the same tile, so tiles cache everywhere. Almost nothing on our map is the same for any two clients. There is our foundation, more than 850,000 human verified places across 17 markets. On top of it sits each client’s own stores, competitors and pipeline, which no other client can ever see. So for every single tile we check who is asking and what they are allowed to see. It has to come back near instant, and we don’t have a tech giant’s budget to do it with. We moved those checks to the point of delivery, and private layers now load from the same edge, at the same speed, as the basemap under them. Otherwise the map feels janky, and nobody signs a lease off a janky map.
What it doesn’t do
Atlas AI doesn’t replace an analyst, and where it hands back to a human is predictable. A market with no mobility or spend history gets no forecast, because there’s nothing honest to train on. A format with no analog in the data gets flagged as exactly that. We don’t attach a confidence interval we can’t back. And what a store costs you to run, whether labor, supply or franchise terms, is your ledger, not our map.
Try it on a live decision
Atlas AI is rolling out across our enterprise clients now. It isn’t scripted. It runs on whatever the platform has, so every new engine or dataset adds to what it can answer.
If you’re screening sites this quarter, we will run one of your live decisions on your own network in a working session, not a canned demo. Bring the site.